Worked with Kimberly Cobarruviaz. Preparing the tourism data for graphing.
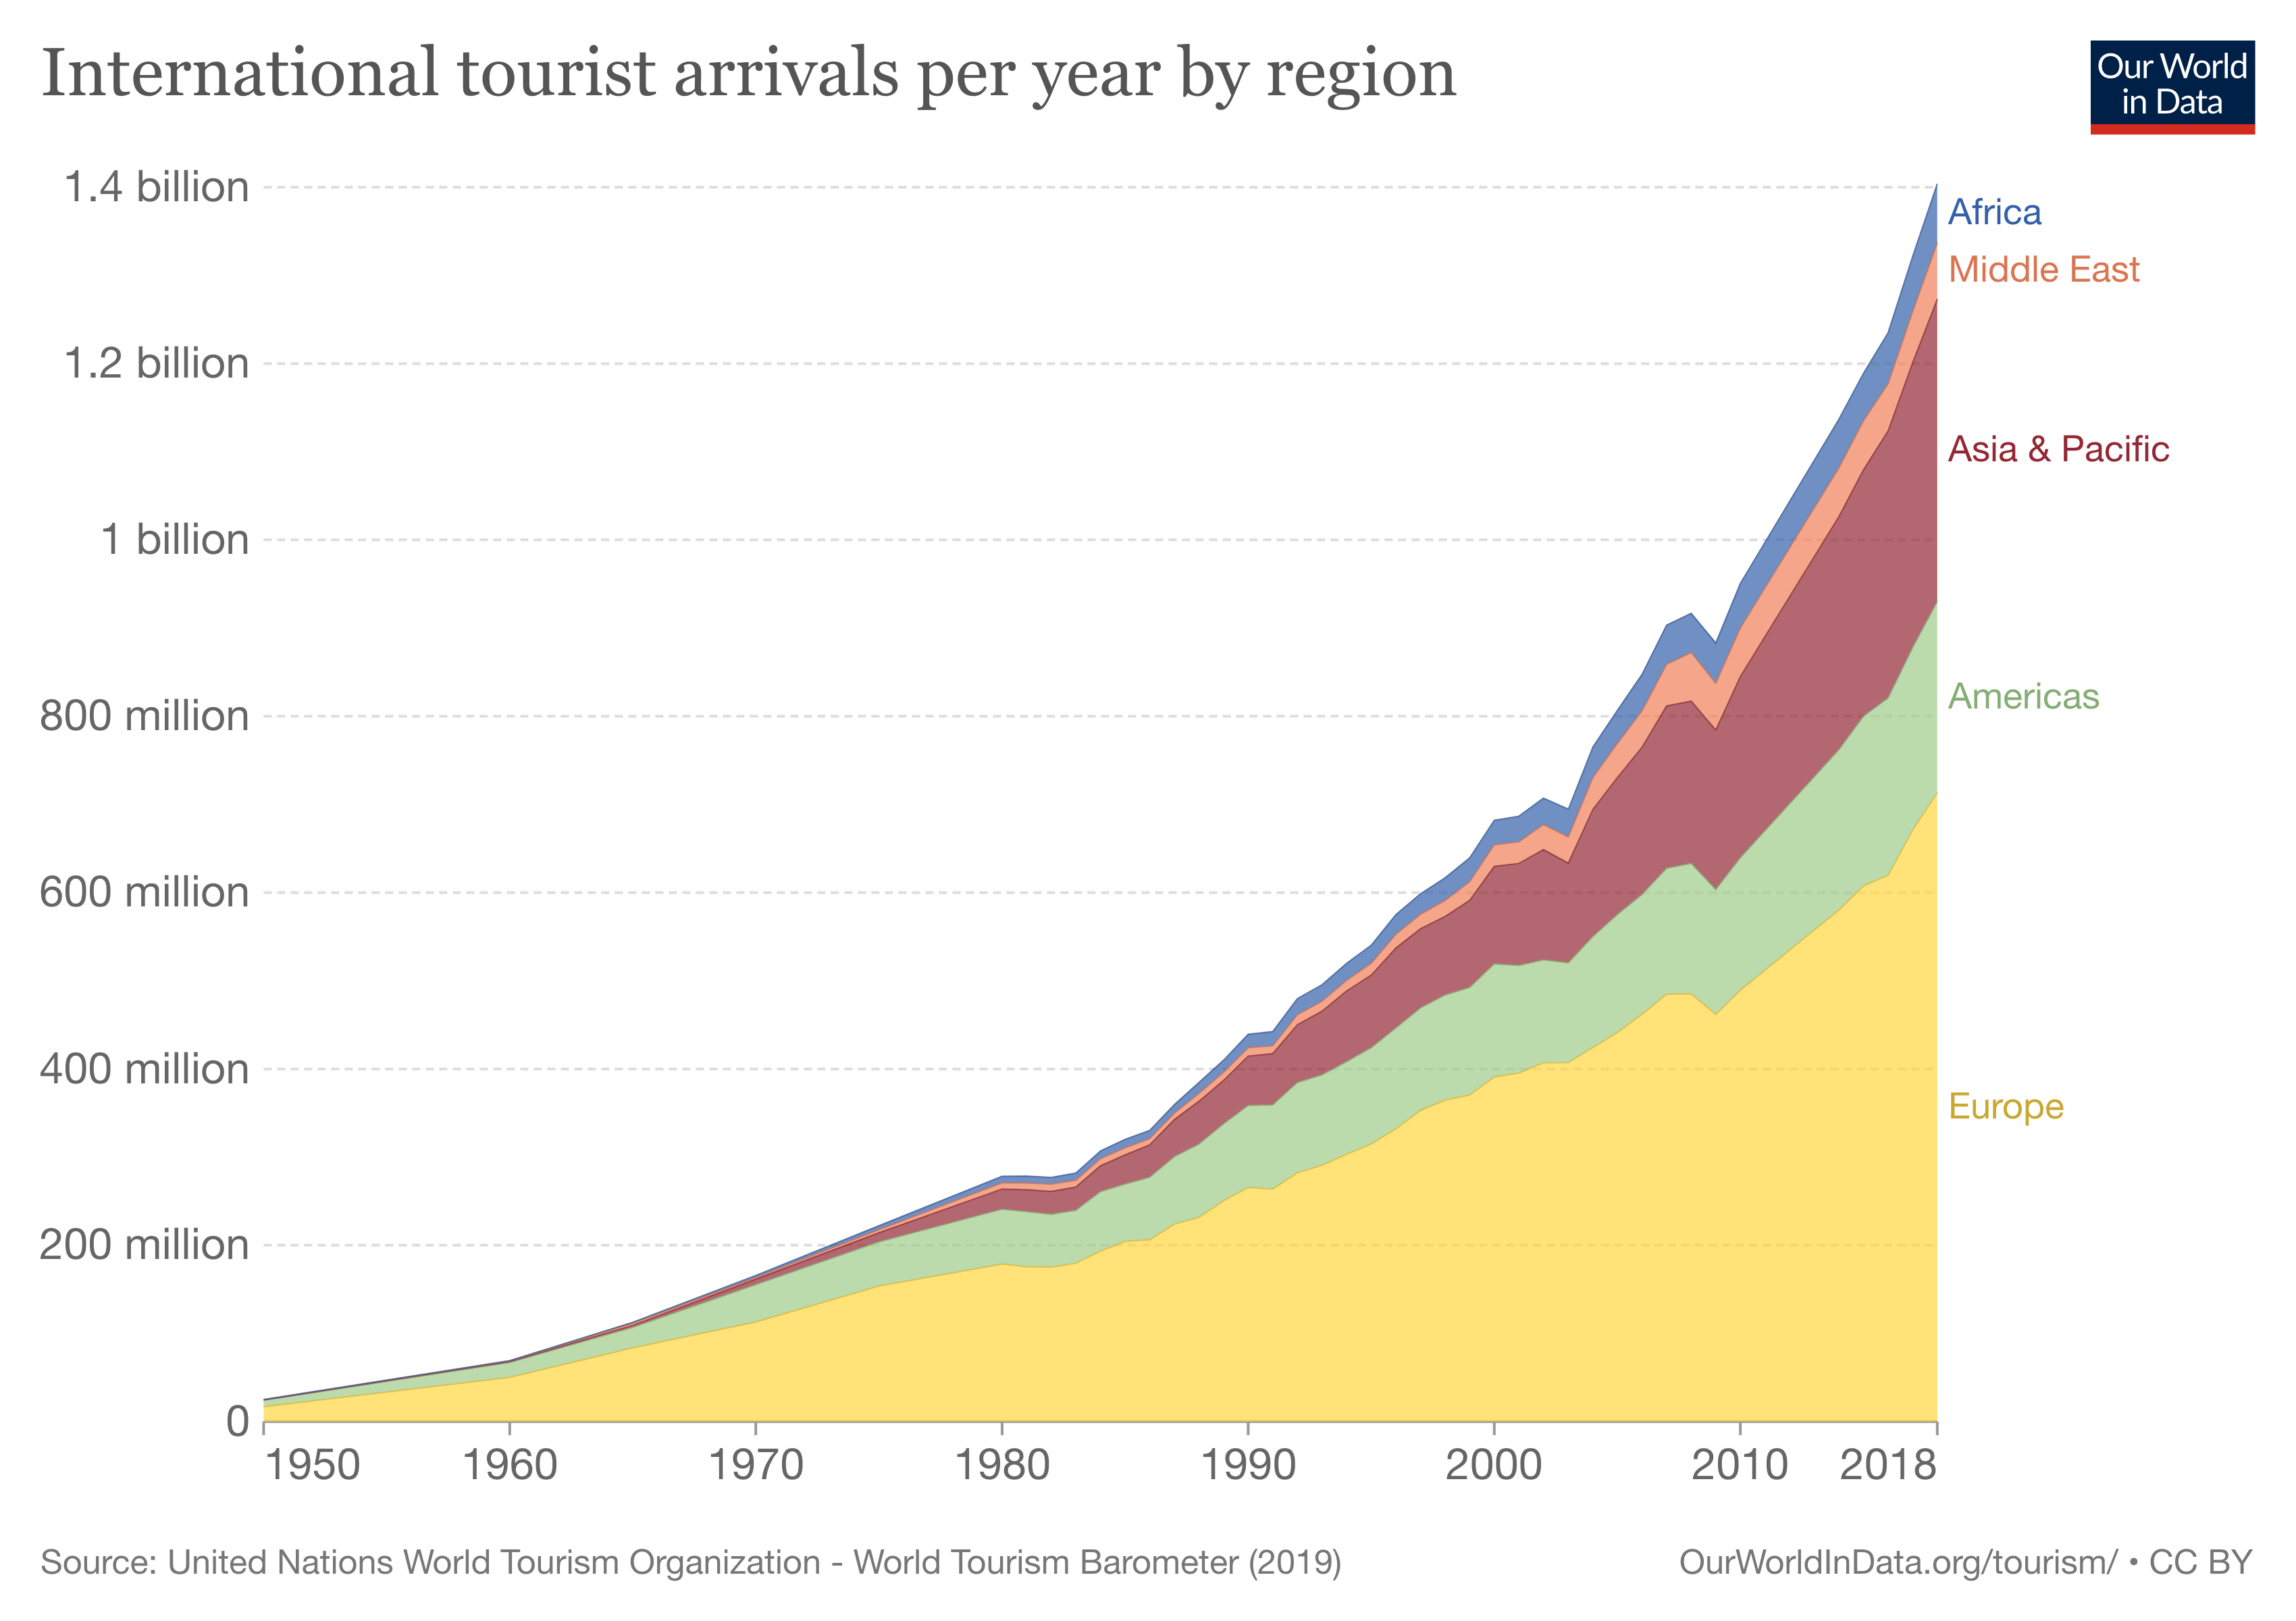
I downloaded the international tourist arrivals data from Our World in Data. I chose this data because with Covid restrictions being lifted, I’m planning on travelling more so I was curious about tourist arrival rates in different regions around the world.
This is the link to the data.
The following code chunk loads the package I will use to read in and prepare the data for analysis.
glimpse to see the names and types of columns.glimpse(tourist_arrivals_by_region)
Rows: 205
Columns: 4
$ Entity                           <chr> "Africa", "Africa", "Africa…
$ Code                             <lgl> NA, NA, NA, NA, NA, NA, NA,…
$ Year                             <dbl> 1950, 1960, 1965, 1970, 197…
$ `International Tourist Arrivals` <dbl> 500000, 800000, 1400000, 24…
#View(tourist_arrivals_by_region)
glimpse (and view) to prepare the data for analysis.Create regions that is a list of regions I want to extract from the data set.
Change the name of the first column to regions.
Use filter to extract the rows that I want to keep. Year >= 2000 and Entity in regions.
Select the columns to keep: regions, year, and International Tourist Arrivals.
Assign the output to regional_tourism.
Display the first 10 rows of regional_tourism.
regions <-c("Africa",
            "Middle East",
            "Asia & Pacific",
            "Americas",
            "Europe")

regional_tourism <- tourist_arrivals_by_region %>%
  rename(Region = 1) %>%
  filter(Year >=2000, Region %in% regions) %>%
  select(Region, Year, `International Tourist Arrivals`)

regional_tourism
# A tibble: 80 × 3
   Region  Year `International Tourist Arrivals`
   <chr>  <dbl>                            <dbl>
 1 Africa  2000                         27900000
 2 Africa  2001                         29100000
 3 Africa  2002                         30000000
 4 Africa  2003                         31600000
 5 Africa  2004                         34500000
 6 Africa  2005                         37300000
 7 Africa  2006                         41400000
 8 Africa  2007                         44300000
 9 Africa  2008                         44400000
10 Africa  2009                         45900000
# … with 70 more rows
Check that the total for 2000 equals the total in the graph.
regional_tourism %>% filter(Year == 2000) %>%
  summarize(total_arrivals = sum(`International Tourist Arrivals`))
# A tibble: 1 × 1
  total_arrivals
           <dbl>
1      682100000
Add a picture.
International Tourist Arrivals by Region
Write the data file in the project directory.
write_csv(regional_tourism, file = "international-tourist-arrivals-by-world-region.csv")